
Demand Forecasting
Forecasts will always be wrong, what matters is how you respond. At b2wise, we avoid the trap of chasing perfection and focus instead on what drives real value. Being demand driven means working within ranges allowing you to filter out noisy forecast tweaks, avoid overreactions, and guiding teams with smart, built-in guardrails. The result: less adjustment and more trust in the forecast.
We call this Stability-Driven Forecasting.
We call this Stability-Driven Forecasting.

What is Stability-Driven Forecasting?
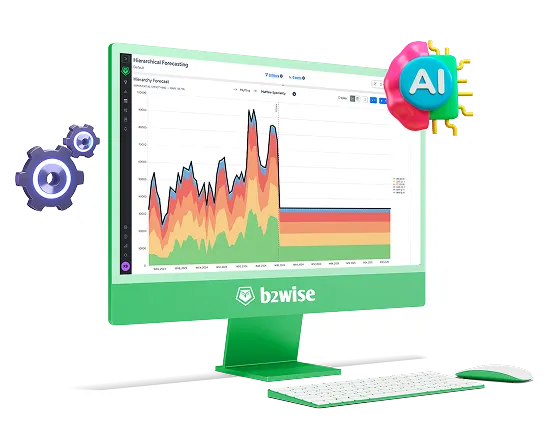
Stability-Driven Demand Forecasting flips the script on traditional statistical forecasting. Instead of chasing perfect accuracy, it works within ranges, only highlighting demand forecast changes that impact the plan. No more wasting time tweaking numbers that don’t matter. With tools like Event Orders for promotions and our proprietary Threshold-based Forecast Accuracy Indicator (TFAI) for forecast relevance, planners focus only on what drives value.
Speak to an Expert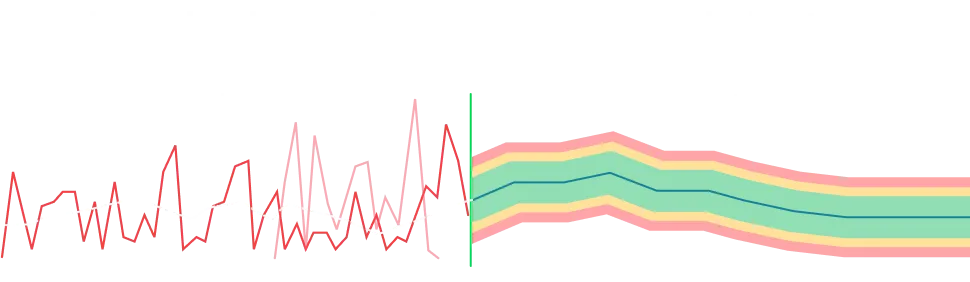
Don't waste your time tweaking the forecast. Only update forecasts that truely matter.

When we implemented DDMRP, we were surprised by how much demand variability the model naturally absorbed. In some cases by as much as 80%. So imagine getting your forecast 80% wrong and still achieving +97% order fulfilment. And with 30% less inventory.
Brian Poole, Supply Chain Business Process Improvement Manager -
How does Stability Driven Demand Forecasting improve your planning process?
Stability Over Reactivity
Cuts noise by blocking unneeded forecast changes.
Stop Chasing Accuracy
Saves time and cost on over-engineered AI Solutions.
Smart Aggregation
It is mathematically proven. Aggregate-Level Forecasts are More Accurate.
Collaborative Forecasting
Brings cross-functional input for better credibility.
TFAI – Forecast That Matters
Only change a forecast will impact the plan.
The 5 Steps of Stability Driven Forecasting
How b2wise Keeps Your Demand Signals Accurate and Stable
Thank you! Your submission has been received!
Oops! Something went wrong while submitting the form.
What a Forecasting Process needs: Your forecast is only as good as the data you feed into it. Cleansing your sales history is essential to remove errors, noise, and outliers that could distort your statistical models.
What b2wise adds: b2wise uses AI Agents to rapidly clean and transform your sales data into a forecast-ready format, while preserving essential signals. It is smart enough to identify erratic and sporadic demand profiles and not remove spikes, which are a key part of this dataset.
What b2wise adds: b2wise uses AI Agents to rapidly clean and transform your sales data into a forecast-ready format, while preserving essential signals. It is smart enough to identify erratic and sporadic demand profiles and not remove spikes, which are a key part of this dataset.
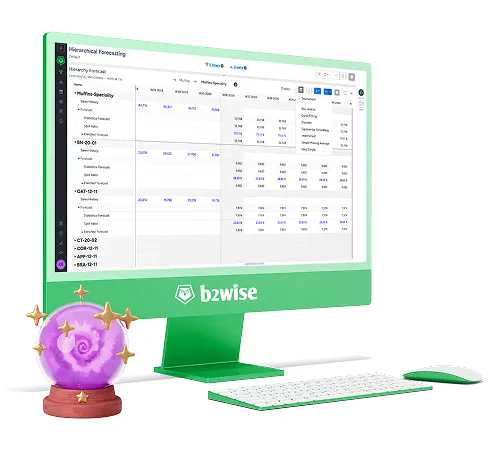
What a Forecasting Process needs: Choosing the right aggregation level is critical. Forecasting too granularly (e.g., product-location) leads to high errors and massive effort. You need to forecast at the level that balances effort with reliability.If you invest time upfront in deciding the best aggregation level for forecast generation, you’ll significantly reduce workload and improve accuracy. Forecasting at a location product level will result in the biggest error and the highest workload.
What b2wise adds: b2wise uses AI Agents to analyze your data and recommend the best aggregation level for maximum accuracy and efficiency. Powered by the trusted Forecast Pro engine, we apply machine learning to create highly accurate, data-driven forecasts that are disaggregated to the location-part level, without overcomplicating the process.
What b2wise adds: b2wise uses AI Agents to analyze your data and recommend the best aggregation level for maximum accuracy and efficiency. Powered by the trusted Forecast Pro engine, we apply machine learning to create highly accurate, data-driven forecasts that are disaggregated to the location-part level, without overcomplicating the process.
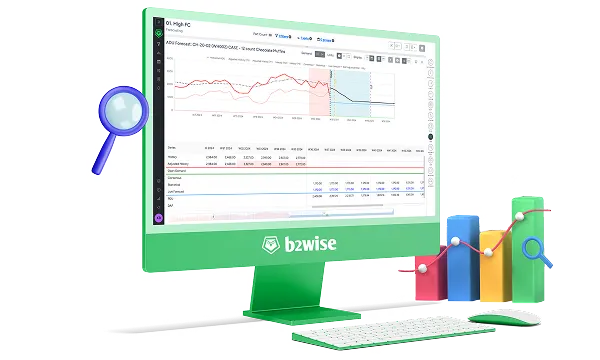
What a Forecasting Process needs: You need to visualize forecasts clearly to understand trends, detect anomalies, and build trust. Forecasting is as much an art as a science, and data tables alone don’t show the full story.The saying “a picture is worth a thousand words” couldn’t be more accurate in demand forecasting. Visual graphs uncover trends, issues, and insights you won’t catch in tables.
What b2wise adds: b2wise delivers powerful forecasting visualizations in daily, weekly and monthly views. You can compare sales history, forecasts, and budgets. Our node enquires, waterfall charts, best-fit performance graphs, and a Forecast Accuracy Indicator focus you on what really matters.
What b2wise adds: b2wise delivers powerful forecasting visualizations in daily, weekly and monthly views. You can compare sales history, forecasts, and budgets. Our node enquires, waterfall charts, best-fit performance graphs, and a Forecast Accuracy Indicator focus you on what really matters.
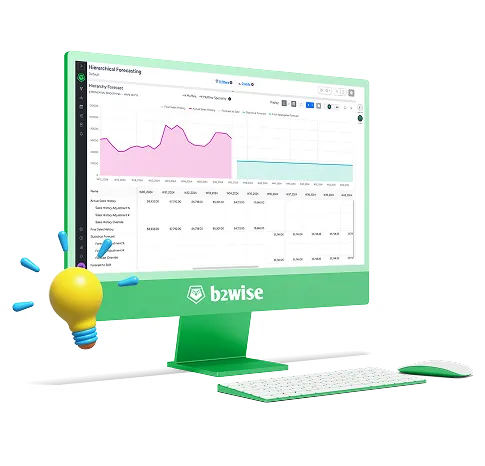
What a Forecasting Process needs: Everyone must work from one version of the truth. You need a simple way for stakeholders to update the forecast and explain why using Units of Measure that make sense to them, without creating chaos for everyone else.
What b2wise adds: b2wise allows your team to update forecasts using the unit of measure that suits them. All updates are tracked to show who made the changes and why before they get accepted. This creates transparency and ensures everyone is enriching the same forecast, not duplicating it.
What b2wise adds: b2wise allows your team to update forecasts using the unit of measure that suits them. All updates are tracked to show who made the changes and why before they get accepted. This creates transparency and ensures everyone is enriching the same forecast, not duplicating it.
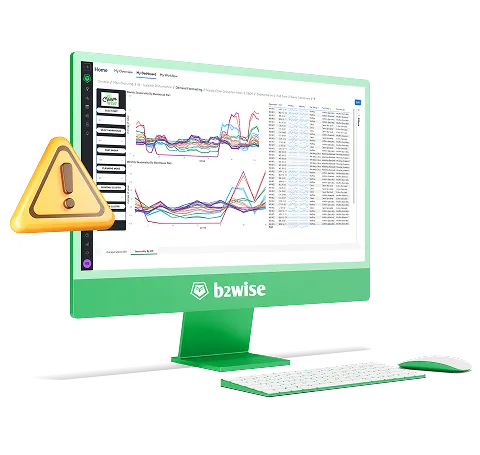
What a Forecasting Process needs: You must measure performance and track what matters—otherwise errors go unnoticed and improvements stall. Alerts and diagnostics are essential.If you don’t measure performance, you can’t improve it. And without alerts, outliers and issues slip through unnoticed.
What b2wise adds: b2wise provides key metrics, including accuracy, bias, error, and TFAI (Threshold-based Forecast Accuracy Indicator). Our exception-based system highlights forecasts that require attention and utilizes reason codes to facilitate root cause analysis. Interesting supplier disruptions are currently the top cause of high forecast errors.
What b2wise adds: b2wise provides key metrics, including accuracy, bias, error, and TFAI (Threshold-based Forecast Accuracy Indicator). Our exception-based system highlights forecasts that require attention and utilizes reason codes to facilitate root cause analysis. Interesting supplier disruptions are currently the top cause of high forecast errors.
Free Resource
Ready to see b2wise in action?